10. Dataset
Dataset
Definition of a Dataset
A dataset (or data set) is a collection of data. In the case of tabular data, a dataset corresponds to one or more database tables, where each column represents a specific variable, and each row corresponds to a particular record in the dataset. For instance, a dataset might list values for variables such as height and weight for each entry in the dataset. Datasets can also be collections of documents or files.
In the field of open data, a dataset serves as the basic unit of information released in a public open data repository. For example, the European data.europa.eu portal aggregates more than a million datasets for public use.
In statistics datasets often derive from real-world observations collected by sampling a statistical population. Each row typically represents the observations for one member of the population. Datasets can also be generated algorithmically, often for testing and validating statistical software. Classical statistical software, like SPSS, presents data in a traditional dataset structure. To address missing or suspicious data, imputation methods may be applied to complete the dataset.
Properties of a Dataset
Several properties characterize a dataset’s structure:
-
Attributes or Variables: These define the dataset’s scope and represent measurable characteristics.
-
Data Types: Values within the dataset can be numerical (e.g., real numbers or integers) or nominal (e.g., categories representing non-numerical data). The type of each variable must be consistent throughout the dataset.
-
Levels of Measurement: Variables may fall into categories of measurement such as nominal, ordinal, interval, or ratio levels, depending on the nature of the values.
-
Statistical Measures: Statistical properties like standard deviation and kurtosis provide insight into the distribution and variability of the data.
-
Missing Values: Missing data, often indicated with specific symbols or codes, may be present and may require methods such as imputation for handling them.
Classical Datasets in Statistical Literature
Several classical datasets are frequently referenced in statistical literature:
-
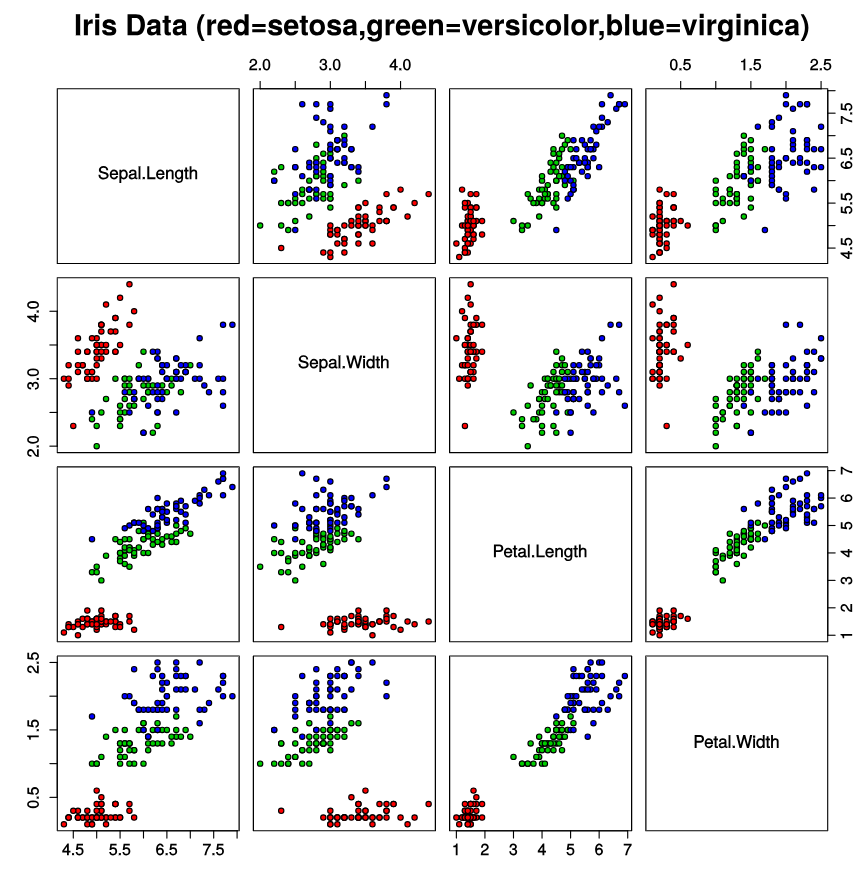
Iris Flower Dataset: A multivariate dataset introduced by Ronald Fisher (1936), available from the University of California-Irvine Machine Learning Repository.
-
MNIST Database: Consisting of images of handwritten digits, commonly used to test classification and clustering algorithms.
-
Categorical Data Analysis Datasets: Available through UCLA Advanced Research Computing, these datasets accompany the book, An Introduction to Categorical Data Analysis.
-
Robust Statistics Datasets: Used in Robust Regression and Outlier Detection by Rousseeuw and Leroy (1968), accessible via the University of Cologne.
-
Time Series Data: Datasets accompanying Chatfield’s book, The Analysis of Time Series, are hosted by StatLib.
-
Extreme Values: Stuart Coles’ book, An Introduction to the Statistical Modeling of Extreme Values, includes these datasets.
-
Bayesian Data Analysis: Datasets for the book by Andrew Gelman are archived and available online.
-
Bupa Liver Dataset: Frequently referenced in machine learning literature.
-
Anscombe’s Quartet: A small dataset illustrating the importance of graphing data to avoid statistical fallacies.
Imbalanced Datasets
An imbalanced dataset occurs when the classes in the dataset are not represented equally. In a binary classification problem, if one class significantly outnumbers the other, we refer to the majority class (more instances) and the minority class (fewer instances). Imbalanced datasets can lead to biased models that favor the majority class, thus compromising the model’s ability to generalize.
The following table provides generally accepted names and ranges for different degrees of imbalance:
| Percentage of data belonging to minority class | Degree of imbalance |
|---|---|
| 40% of the dataset | Mild |
| 20% of the dataset | Moderate |
| 1% of the dataset | Extreme |
Degree of imbalance based on percentage of data belonging to the minority class.
For example, consider a dataset in an AI-generated text detection project where the minority class (human-written text) represents only 0.5% of the dataset, while the majority class (AI-generated text) represents 99.5%. Extremely imbalanced datasets like this are common in text analysis.
Imbalanced datasets can cause issues such as:
-
Models biased toward the majority class, resulting in poor performance on the minority class.
-
Reduced accuracy in detecting the minority class, often critical in fields like fraud detection and medical diagnosis.
Techniques to Address Imbalanced Datasets There are several techniques to handle imbalanced datasets effectively:
-
Resampling Methods:
-
Oversampling the minority class by duplicating its examples to balance the dataset.
-
Downsampling the majority class by training on a reduced subset of majority examples. For instance, in a virus detection dataset, downsampling by a factor of 10 changes the ratio from 1 positive to 200 negatives (0.5%) to 1 positive to 20 negatives (5%), improving balance.
-
-
Upweighting the Downsampled Class: After downsampling, assign an example weight to the majority class proportional to the downsampling factor, increasing its importance during training. For example, if downsampling by a factor of 10, apply a weight of 10 to the downsampled class examples.
-
Synthetic Data Generation: Use techniques like SMOTE (Synthetic Minority Over-sampling Technique) to generate synthetic examples for the minority class. It addresses class imbalance by generating synthetic data points for the minority class. It does so by selecting a sample and its nearest neighbors, creating new instances within this neighborhood. However, SMOTE may introduce noise if minority samples overlap with other classes. A variation, Borderline-SMOTE, focuses only on samples near the decision boundary, avoiding overlap. These methods help improve classification in imbalanced datasets.
-
Algorithmic Adjustments: Modify algorithms to handle imbalanced data more effectively, such as adjusting decision thresholds or applying algorithms that consider class weights.
-
Evaluation Metrics: Utilize metrics like precision, recall, F1-score, and AUC-ROC instead of accuracy to better evaluate performance on imbalanced data.
-
Experiment with Rebalance Ratios: To determine the optimal downsampling and upweighting ratios, treat them as hyperparameters. Factors such as batch size, imbalance ratio, and training set size should be considered; ideally, each batch should contain multiple examples of the minority class.


